


A personal note and some powerful Covid charts

A quick personal note. It’s a sober day at the Hart house:


Jenny just experienced another miscarriage (our third during the pandemic). Of course, we also welcomed another beautiful daughter August 2021 and we are blessed with 8 children in our Brady Bunch family.
And the show must go on! I suppose I distract and lose myself in data and charts is one way for me to cope with these challenges and fortunately we count many of you as good friends and we love you for your support over this year. Thank you.
Covid Charts!
We’ve posted numerous times over the past years charts and exports from the CDC Covid Case Surveillance File. It’s a beast of a file - clocking in at 11 gigabytes but it provides some of the most detailed national data we can get for the United States.
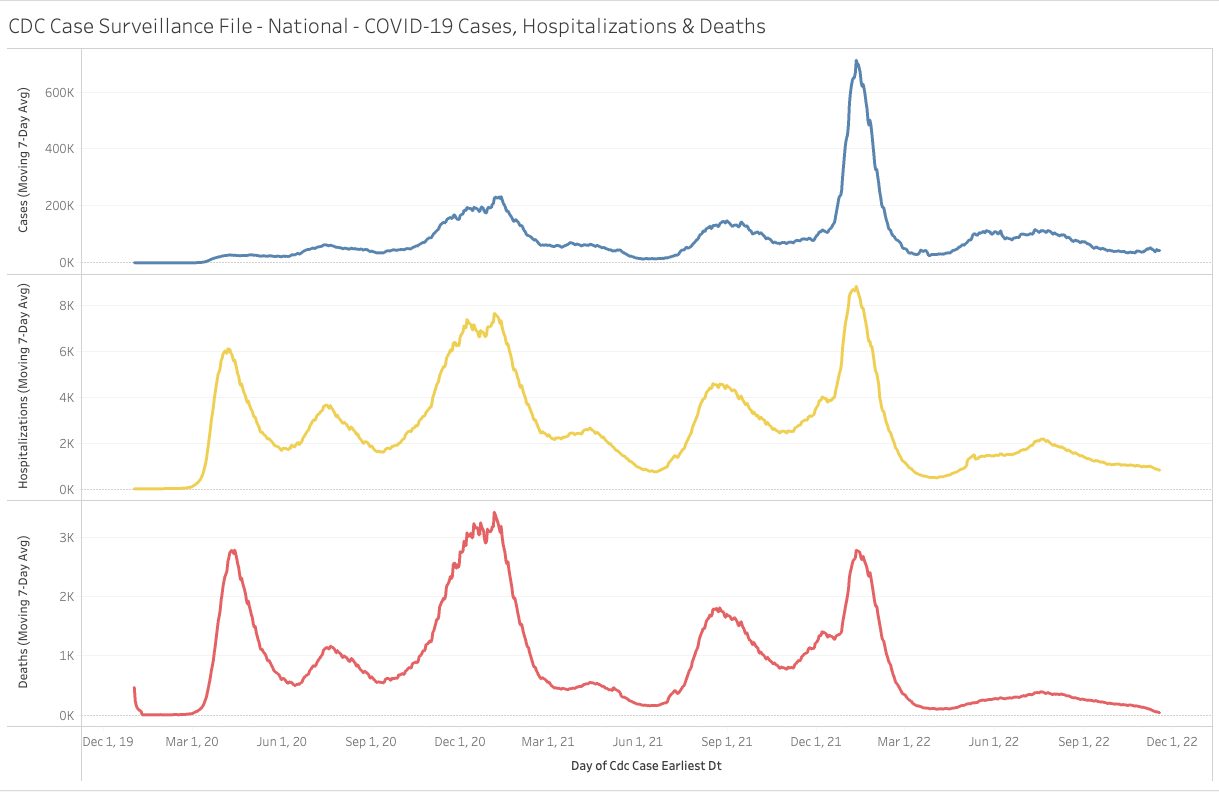
Below are our usual set of charts from the most recent export from the CDC which we’ve limited from Jan 1 2020 to November 15 2022.
I will be SIGNIFICANTLY ramping up paid subscriber emails and so I encourage you to jump and in subscribe. $7/month or $70/year.
Here’s a JUICY chart. How many Covid deaths are there from the pandemic in the U.S.?
The CDC has "confirmed" 923,710 deaths. But if you use an "apples to apples" comparison on how they track other respiratory burdens then you would have to conclude that there have been 347,601 deaths.
In other words, the MASTER record that the CDC uses to track cases and deaths has only 347K deaths that have complete information (clinical date, lab-confirmed sample)

This is data taken from the massive CDC Case Surveillance File. The data include: - 2 clinically relevant dates (onset of illness and/or specimen date). - a lab-confirmed case: yes/no - Hospitalization: yes/no Only 367K deaths meet these criteria, maybe even 347K:
MORE FOR PAID SUBSCRIBERS:

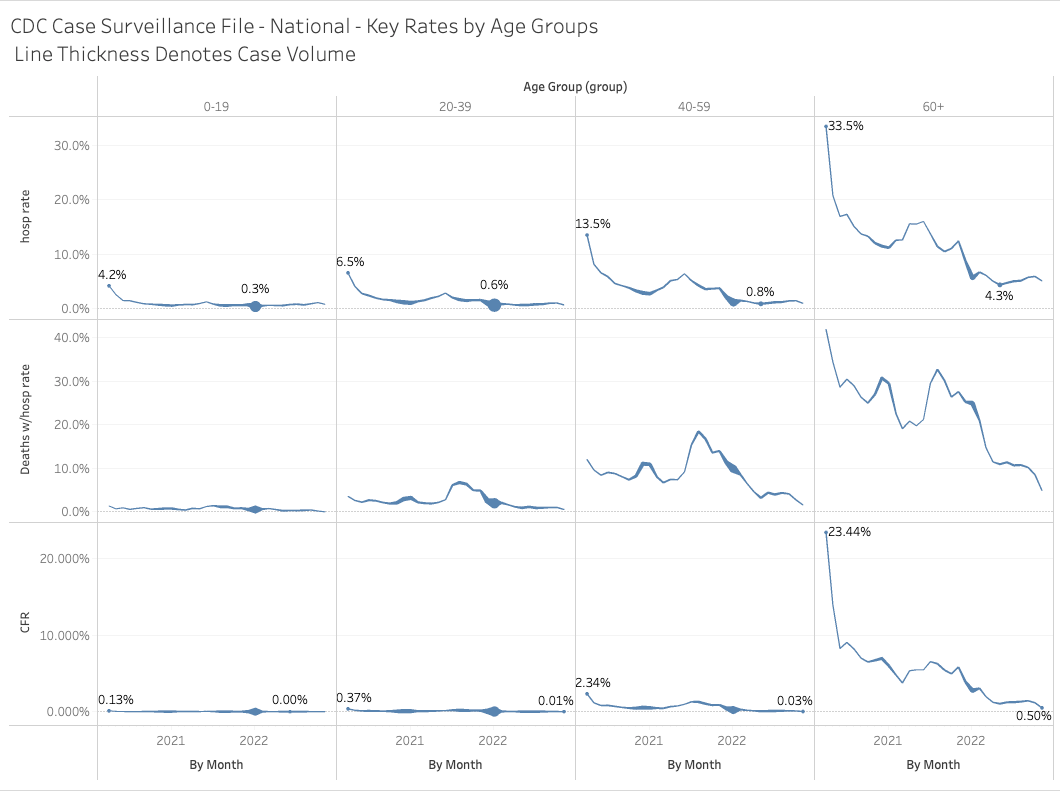
First set of pics are the core stats by month and age. The file itself is pretty simple but it has the basic funnel we need: date, hospitalization, ICU, death. From those funnel items we can glean a bunch of rates and a few other stats.
Medcond = noted medical condition.
Deaths (w/Hosp) are deaths which ALSO have a hospitalization note
hosp rate are Hospitalizations / Cases
ICU rate is ICUs / Hospitalizations
deaths w/hosp rate are deaths to hospitalizations with a hops. status marked as “yes”
CFR - the raw total of deaths / cases
For subscribers download!
Here are the core stats by month and by age in a big excel file.


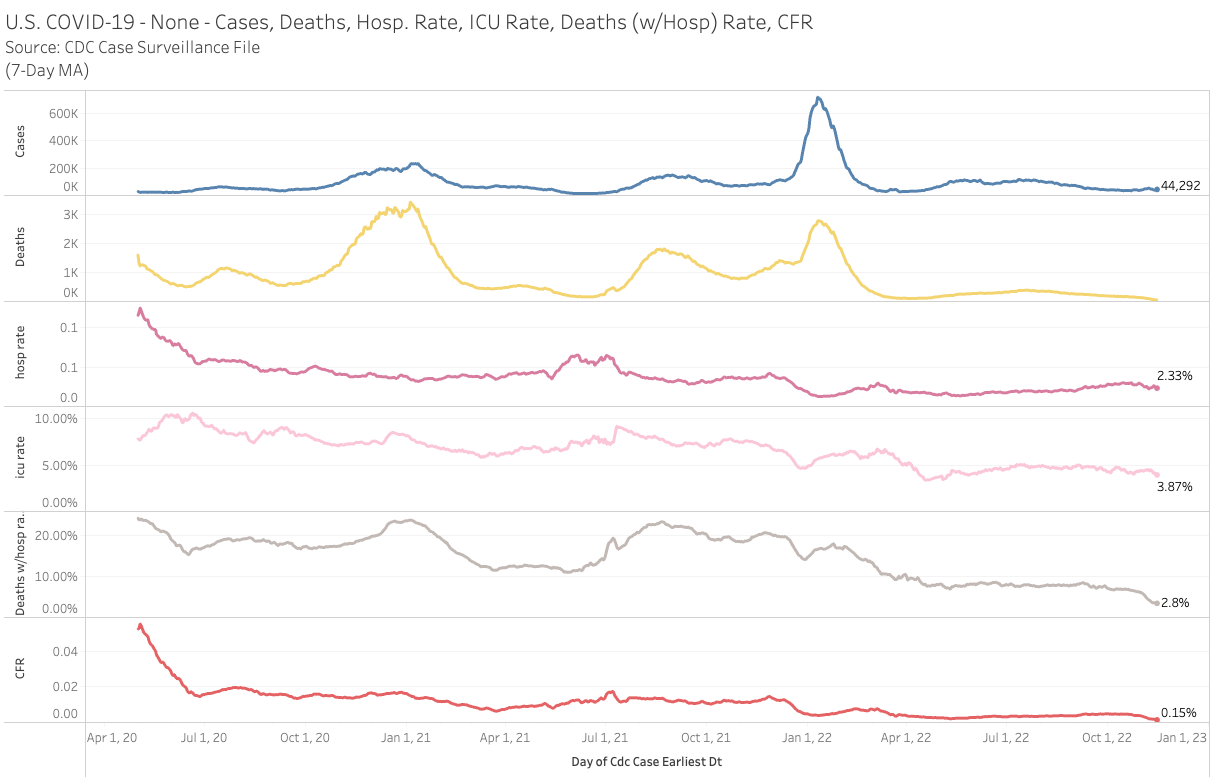
The next set of charts show many of these same metrics by timeframe in a visual representation. Here you can CLEARLY see the massive drop in the rates by age group - part of this could be due to testing ratios but when you look at deaths with hosp. rate those should be normalized for some excellent comparisons.
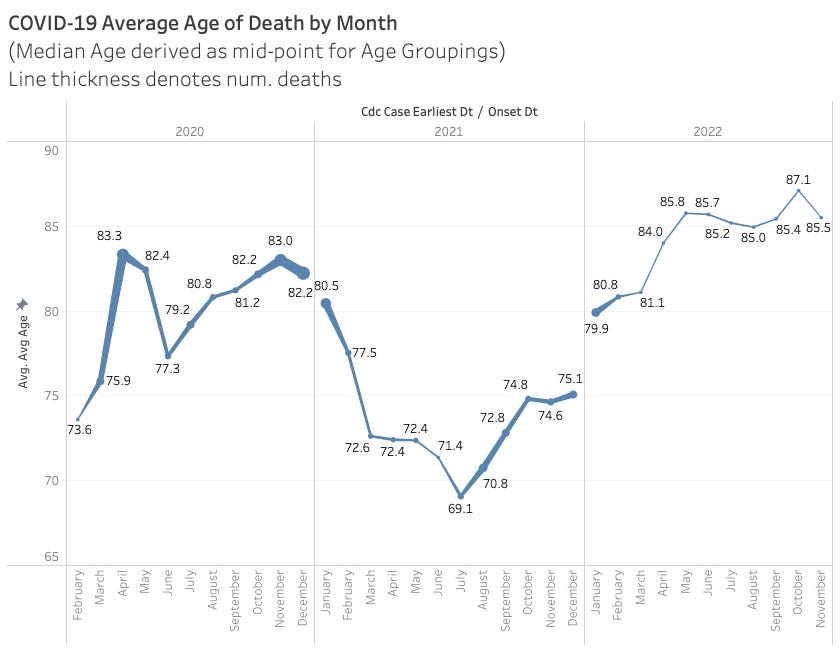
This chart is very interesting. It shows average age of death for each month of the pandemic and you can see the age drop during 2021 which could be from “pull forward deaths” but it could be from other reasons including larger impact of the Delta variant.
Next slides show breakdowns by age and ethnicity and color-code the impact of the case fatality rate.


I’m so sorry. Been there myself (5 early losses). It’s tough to understand God’s plan through that pain.
Justin, So sorry for your loss. The body is far better at finding angel babies than usually credited (and, knowing the complexity of the process, the fact that there are ANY normal babies born is amazing) and as sad as it is, that is usually things working the way they should. You are blessed to have so many that have come through with flying colors!
Thanks for all you do. It has made a real difference in many of our lives.