COVID-19 Core Stats: A Walkthrough
The CDC Case Surveillance File is large. Very large. Let's boil it down for you.
How large is the CDC Case Surveillance File? Over 4GB in size (as a CSV file) and 37 MILLION rows. You likely won’t be able to open that thing in Excel. Primarily - I use Tableau but Microsoft BI or Domo or any number of other tools can handle it.
(Note: these tools can be expensive! - so thank you for your support!)
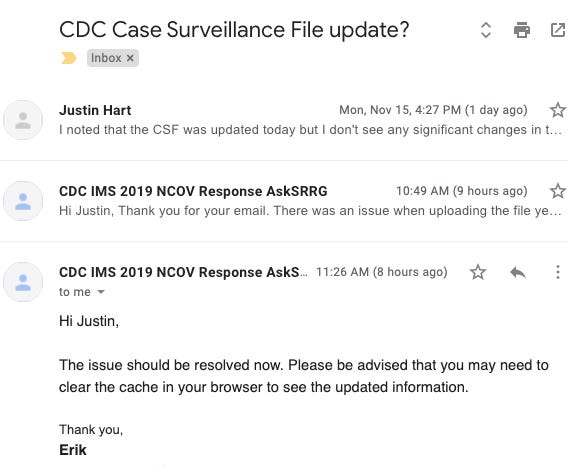
We’re gonna walk through the latest update to the file which came out today. Actually, it came out yesterday but I emailed the CDC that the file DID NOT update as well. Surprisingly, “Erik” was manning the inbox and updated the file per my request!
So - somebody’s home at least!
Let’s get into it. Tonight, I’m just going to share the CORE stats at a month level so we can see the surge of cases, hospitalizations, deaths and other stats we can get from it. And - for subscribers - you’ll receive the full download tomorrow morning.
(If you missed why this file is so valuable be sure to read “The Mighty Case Surveillance File” )
Core Stats Explained
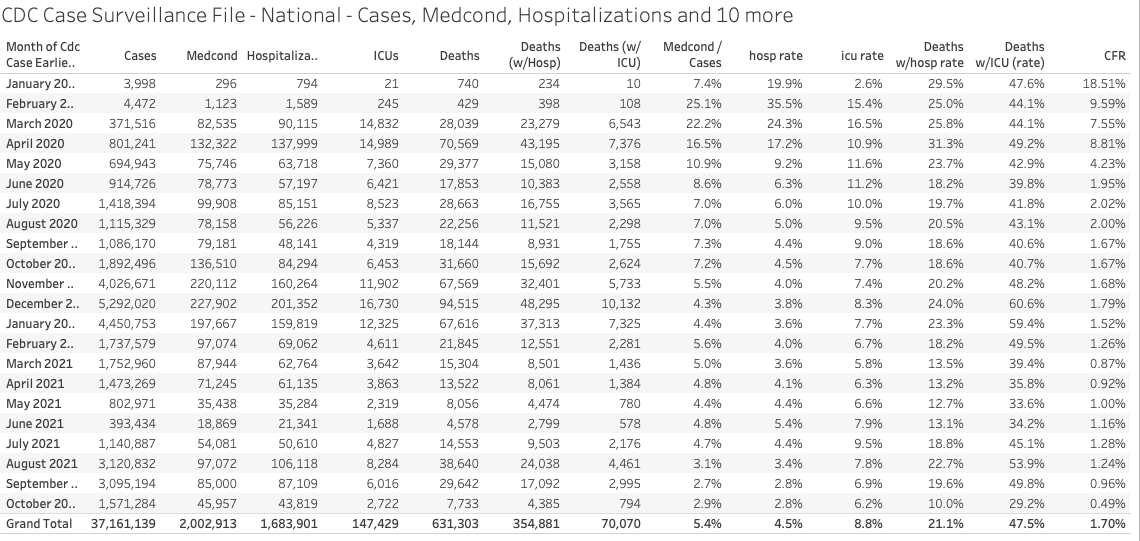
Below are the overall stats provided by the CDC CSF through October 24th. As a gauge this file accounts for 631,303 deaths and the data will update across the months. As we noted earlier today — sometimes the stats update even into LAST YEAR. Since each row represents a “case” of COVID-19 the rest of the core stats are “toggles” on and off. So, if the case had a denoted hospitalization the Hosp. field would = “Yes.” (For each one of these stats I have to create a “measure” based on that field.)
Cases: 37,161,139 - These are the number of rows in the table representing a specific case. Note that this file has no geography… this is all national.
Medcond: 2,002,913 - This refers to the number of cases denoted with a medical condition.
Hospitalizations: 1,683,901 - These are number of cases indicated with a hospitalization.
ICUs: 147,429 - number of documented cases which were put into intensive care.
Deaths: 631,303 - Cases with a toggle of Death = “Yes”
Deaths (w/Hosp): 354,881 - This is a created measure on my part. If Hosp = “Yes” and Death = “Yes” then this field gets a count. Note that there almost half of all deaths have no record of a hospitalization.
Deaths (w/ ICU): 70,070 - Number of rows with a death and an ICU noted.
Then we get into the rates - the ratio of these measure to each other. Most of these are self-explanatory.
Medcond / Cases: 5.4%
hosp rate: 4.5% - Hospitalizations to Cases
icu rate: 8.8% - % of hospitalizations which turned into ICUs
Deaths w/hosp rate: 21.1% - ratio of deaths with a hospitalization compared to hosp. rate
Deaths w/ICU (rate): 47.5% - you’re reading that correctly nearly half of ICUs eventually died.
CFR : 1.7% - We’ve talked a lot about this stat before. More on this later.
Here’s how that looks across each month:
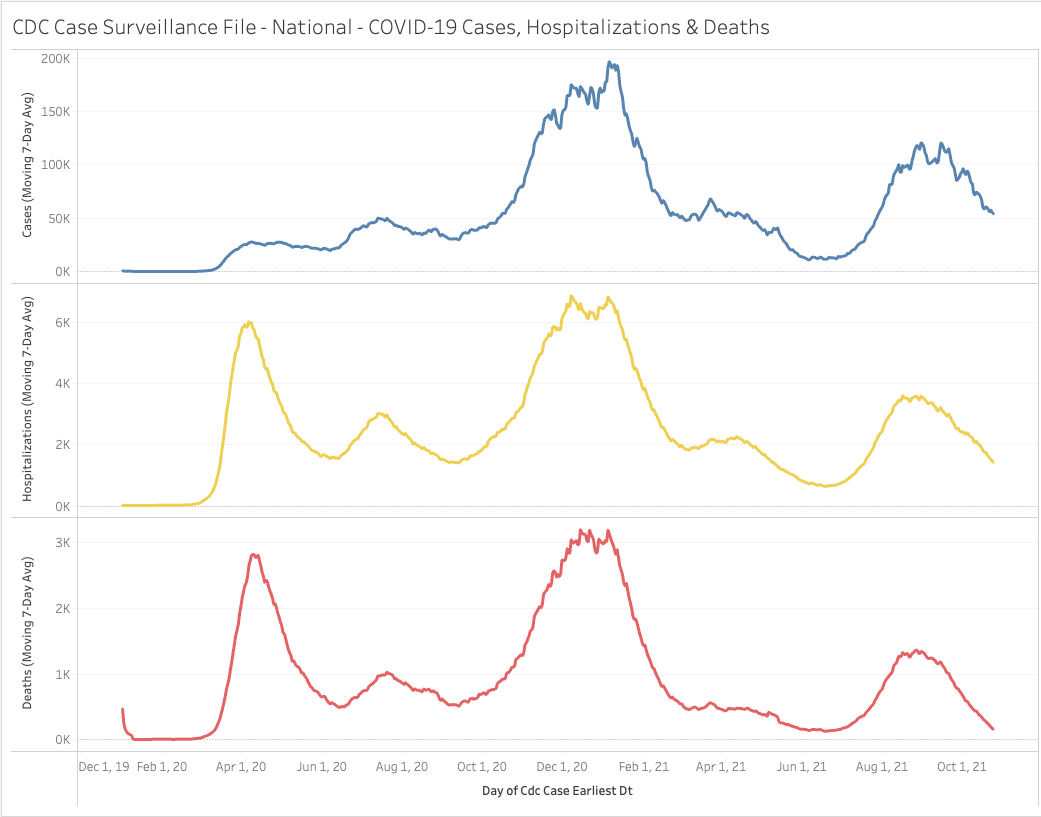
Here’s a quick visual on the 3 main stats:
We’ll publish some more in the morning. This is just to whet your appetite!


I was surprised to see Medcond so low at 5.4%. Maybe there's a separate medcond % for hospitalizations & deaths? Am I under a mistaken understanding that most serious cases (hospital, ICU, etc) also have an underlying condition like hypertension, obesity, etc? Will watch for more info!
I downloaded it, thanks for the heads up. Will see if I can have a play with it in the coming weeks. Interested to see what you write about it in the mean time.