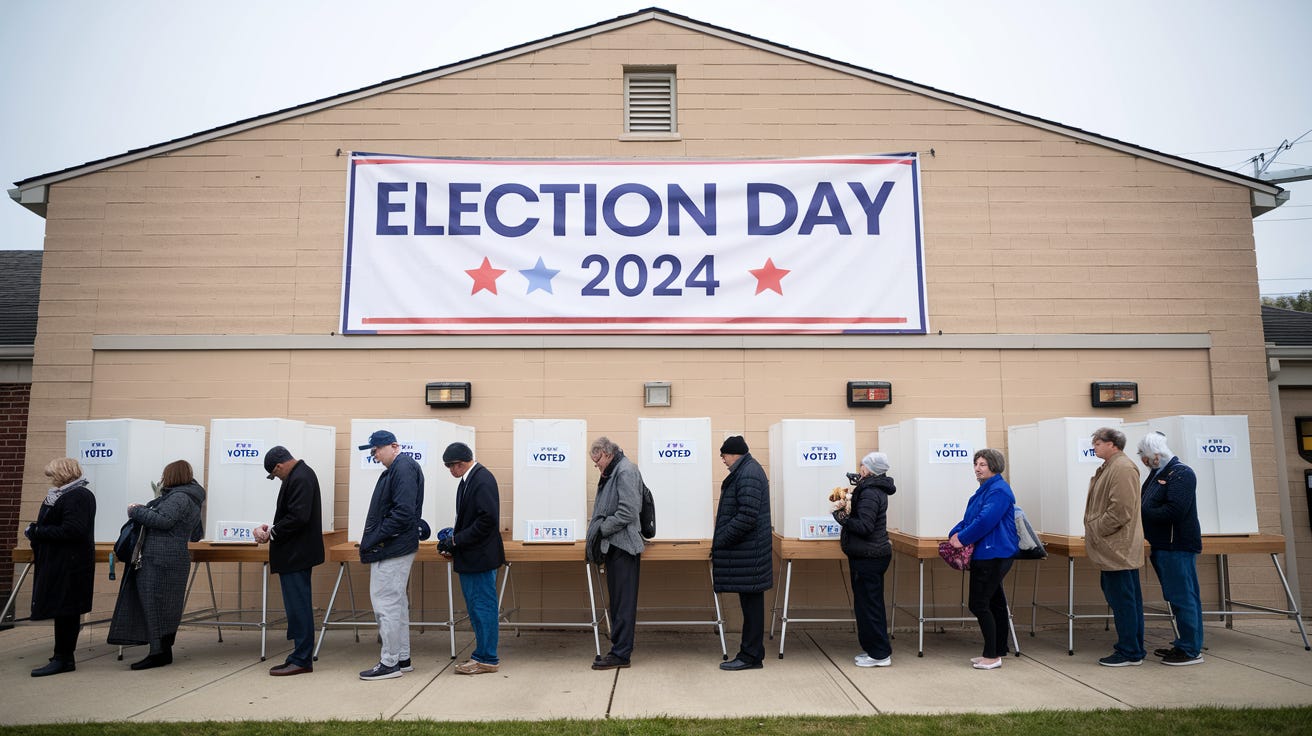
As voters head to the polls this morning, let's break down the final early voting data across three battleground states that could determine the outcome of the presidential race.
Arizona: Republican Momentum into Election Day
Final early vote totals solidify a strong Republican position:
Republicans: 954,306
Democrats: 758,342
Others: 625,731
Total early votes: 2,338,379
Current advantages:
Raw Republican lead: 195,964 votes
Republican vote share: +8.4% of current electorate
Total early vote represents ~68% of expected turnout
Mathematical paths to victory: For Harris to achieve a statistical tie, modeling requires (according to Michael Pruser):
9% Republican crossover vote
97% Democratic retention
55% of the Independent vote (compared to Biden's previous performance)
Key factors:
Election Day voting historically favors Republicans in Arizona
Late-arriving mail ballots typically break Republican
Projected final gap could exceed 300,000 raw votes
Final electorate projections: Between R+8.5 and R+10
Critical battlegrounds: Maricopa and Pima margins vs. rural gains
Nevada: Tight Race with Mail Variable
Latest Secretary of State report shows final pre-election numbers:
Republicans: 410,179
Democrats: 367,941
Others: 310,972
Total early votes: 1,089,092
Current metrics:
Republican raw vote advantage: 42,238
Republican vote share: +3.9% of current electorate
Total represents 78.2% of 2020's total turnout
Three-day trends:
Democratic mail reduced Republican lead by 7,000 ballots
Clark County mail patterns suggest low trailing mail totals
Frequency scores indicate diminishing returns on late mail
Remaining vote composition:
~300,000 votes expected between Election Day and trailing mail
Historical patterns suggest even R/D split in remaining votes
Republican turnout advantage projected to maintain 8-point lead
Final raw turnout lead expected within ±5,000 of current margin
Pennsylvania: Dramatic Early Vote Realignment
Current mail-in ballot status:
Democrats: 1,014,744 (55.4%)
Republicans: 602,601 (32.9%)
Democratic "firewall": 412,000 (vs. 1.1M in 2020)
Detailed comparison to 2020: Democratic changes:
2020 early votes: 1.7 million
2024 early votes: 907,000
Net decline: 704,000 ballots
Percentage of 2020 performance: 53.1%
Republican changes:
2020 early votes: 621,000
2024 early votes: 530,000
Net decline: 16,000 ballots
Percentage of 2020 performance: 85.4%
County-level analysis: Bucks County:
Republican early voting: 42,904 (+16.6% from 36,796 in 2020)
Democratic early voting: 65,241 (-26.77% from 89,093 in 2020)
Cumberland County:
Showing similar 30% Democratic decline
Republican voting up approximately 14%
Northampton County:
Republican early voting: +18.48% vs 2020
Following suburban county pattern of Democratic decline
2022 to 2024 momentum:
Republican gains: +339,000 returned ballots
Democratic gains: +157,464 returned ballots
Return rate parity: Democrats 84.5%, Republicans 84.2%
Final week registration changes:
Republican gains: 9,451 switches
Democratic gains: 5,602 switches
Current Democratic registration advantage: 281,000
Historical context: Down from 1 million pre-2016
Election Day projections:
Trump needs: 12-point Election Day victory margin
2020 reference: 30-point Election Day Republican advantage
Critical factor: Suburban county performance vs. rural margins
FOR PAID SUBSCRIBERS - ACCESS IT ALL HERE
Today's Key Metrics to Watch
Arizona turnout patterns:
Maricopa County suburban precincts
Rural county acceleration rates
Late-mail party composition
Nevada variables:
Clark County Election Day turnout
Rural county Republican margins
Last-minute mail ballot returns
Pennsylvania indicators:
Suburban county Election Day turnout
Rural vs. urban turnout ratios
Mail ballot rejection rates
Early results from Bucks/Cumberland/Northampton
We'll be tracking these metrics throughout the day as results begin to come in. The early vote data suggests significant shifts from previous cycles, particularly in Pennsylvania's suburban corridors and Arizona's overall party composition. The question now becomes whether Election Day turnout patterns reinforce or reshape these pre-election trends.
Check back throughout the day for live updates and analysis as the results begin to paint the final picture of this election cycle.


