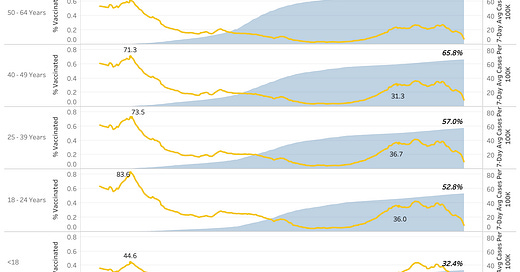
The CDC has updated it’s dataset: “COVID-19 Vaccination and Case Trends by Age Group, United States.” This is one of the ONLY datasets which looks at vaccine data in combination with an epidemiological metric.
We have TONS of datasets on vaccines and pregnant women, vaccines and demographics nationally, vaccines and demos down to the county level, even vaccine locations! But we have very few data points which map vaccine rates to cases, hospitalizations or even deaths.
The CDC has deigned to let us see vaccines and cases by age group and here’s what it shows.
The green line denotes the COVID-19 case rate by date and the growing area is the % of that age group totally vaxxed. A few notes:
Notice that the case rates for every single age group drop 75% before anyone even gets to 10% vaccinates. This was the end of the winter wave.
Notice the summer wave of cases by age group essentially completely ignores any growth in vaccination rates.
Even in the paltry <18 vaxxed group the cases went down from the hyperbolic declarations of many in the press
In his recent New York Times piece, David Leonhardt discusses the “Covid fable” of good behavior impacting covid rates.
In the case of Covid, the fable we tell ourselves is that our day-to-day behavior dictates the course of the pandemic. When we are good — by staying socially distant and wearing our masks — cases are supposed to fall. When we are bad — by eating in restaurants, hanging out with friends and going to a theater or football game — cases are supposed to rise.
I would love to see David address the notion that vaccination rates do NOT seem to be a determining factor in the waves we see either.
In the words of Alex Berenson - the virus is gonna virus.
Are you subscribed - I mean really subscribed to the newsletter? This week paid subscribers got early access to many articles and access to these membership articles and datasets:


