From our friends at Burbio:
This week we look at mask mandate trends across the academic year, an example of shifts in food service delivery looming in K-12, and a snapshot of ESSER III actual spending.
Burbio ESSER III Tracker + Enrollment Trends
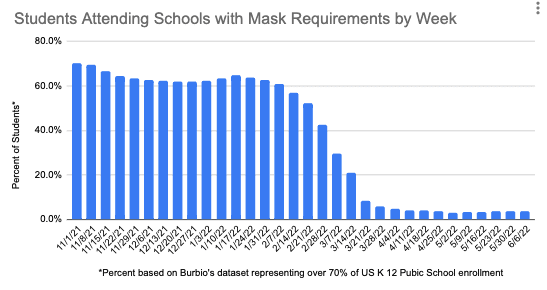
1. With the school year winding down, we present a summary look at mask mandate trends. From November 1st Burbio has actively audited 5,000 school districts representing over 70% of the US K-12 student population for this element of Covid 19 mitigation. Below is a chart that shows the percent of the student population that attended K-12 schools with mask requirements on a weekly basis over the last eight months:
2. As noted above, Burbio is launching a service measuring K-12 school budgets, and going forward we will highlight both broad trends and specific instances that illustrate K-12 spending across everything from technology, staffing, infrastructure, instructional support, transportation, and more. This week we start with an excerpt from a budget involving food service that represents a trend we are seeing in many budgets nationwide.
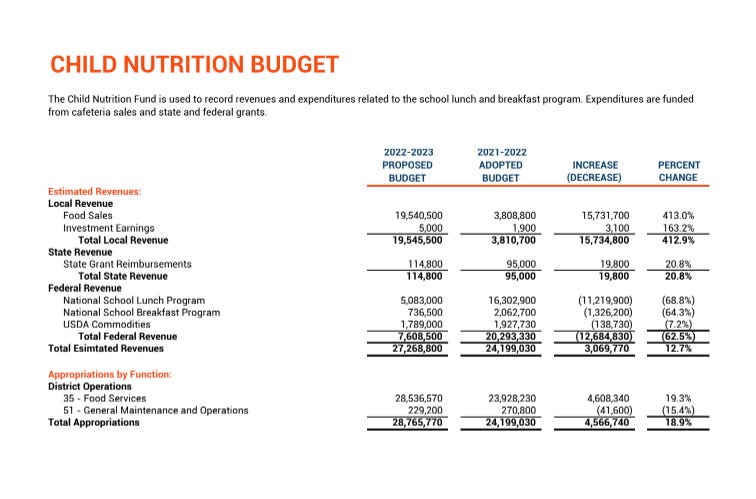
Barring additional legislation the Federal universal free meals program is expiring on June 30th and many districts across the country are budgeting to once again charge a portion of students for meals, as well as add back administrative elements to manage payments and eligibility requirements for students who are still eligible for free and reduced-priced meals. Note below this excerpt from the Frisco ISD, TX budget. In FY 2021/22, the National School Lunch Program provided $16.3MM of revenue to the district. That revenue will drop to $5.1MM in 2022/23. Food sales are budgeted to increase from $3.8MM to $19.5MM. Department expenses are increasing by $4.6MM (18.5%) and expenses exceed revenue by roughly $1.5MM for the Child Nutrition Budget:
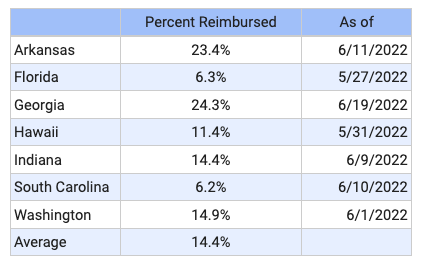
3. States have begun reporting ESSER III reimbursed spending levels and Burbio is integrating district level actuals into our growing ESSER III plan dataset. There are lag times in much of the reporting, but this week we wanted to highlight seven states where information has been updated since late May. The average spend is just over fourteen percent across these states:


