REMINDER: TODAY AT NOON PACIFIC / 3:00PM EASTERN: We’ll be interviewing Jennifer Sey and Daniel Kotizen
As we’ve been telling you in these pages and our podcast, our health overlords have seen fit to paint the worst picture possible derived from bad, bad data to force a policy bias which impacts EVERYONE!
The latest foray in this underhanded tactic is to publish weekly data about the vaccinated and unvaccinated stats and call that the truth — ALL THE WHILE KNOWING that data lags and that the truth is something else altogether.
We walked you through how Biden’s 97x number is a complete fallacy and uses incomplete and erroneous data to make its assumptions.
Bottom line: hospitals must validate the vaccination status of patients but that takes time. Couple that with old population data and you get garbage in, garbage out for your data results.
NOW, more validation to the theory that HOLD2 (Clayton Cobb) surmised has surfaced after New York State officials FINALLY updated a critical table in their downloads. This is cross-posted below from Clayton’s new Substack which you should definitely subscriber to!
CROSS-POSTED FROM HOLD2.SUBSTACK.COM
Ok, after waiting a week without explanation, we got all the way to the next weekly update. Thankfully, they updated Weekly Breakthroughs.
And the GitHub team responded finally today but not until the data were updated. They did not explain what happened over the past week.
Are you ready?
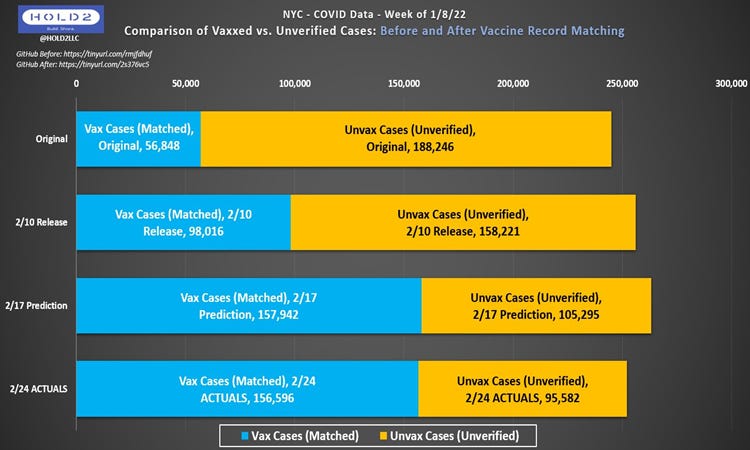
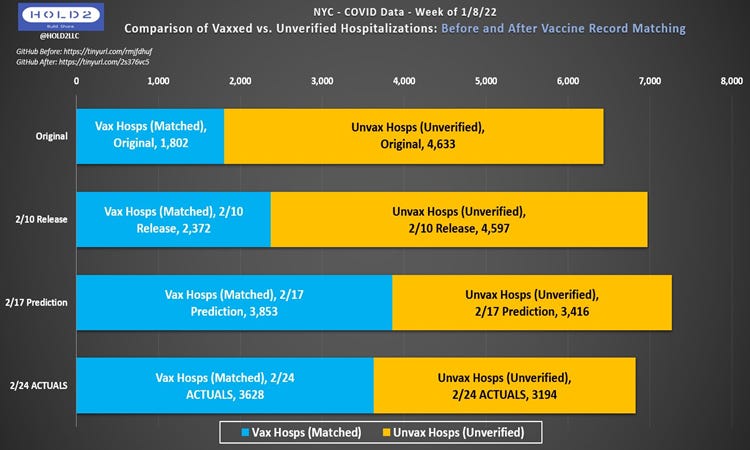
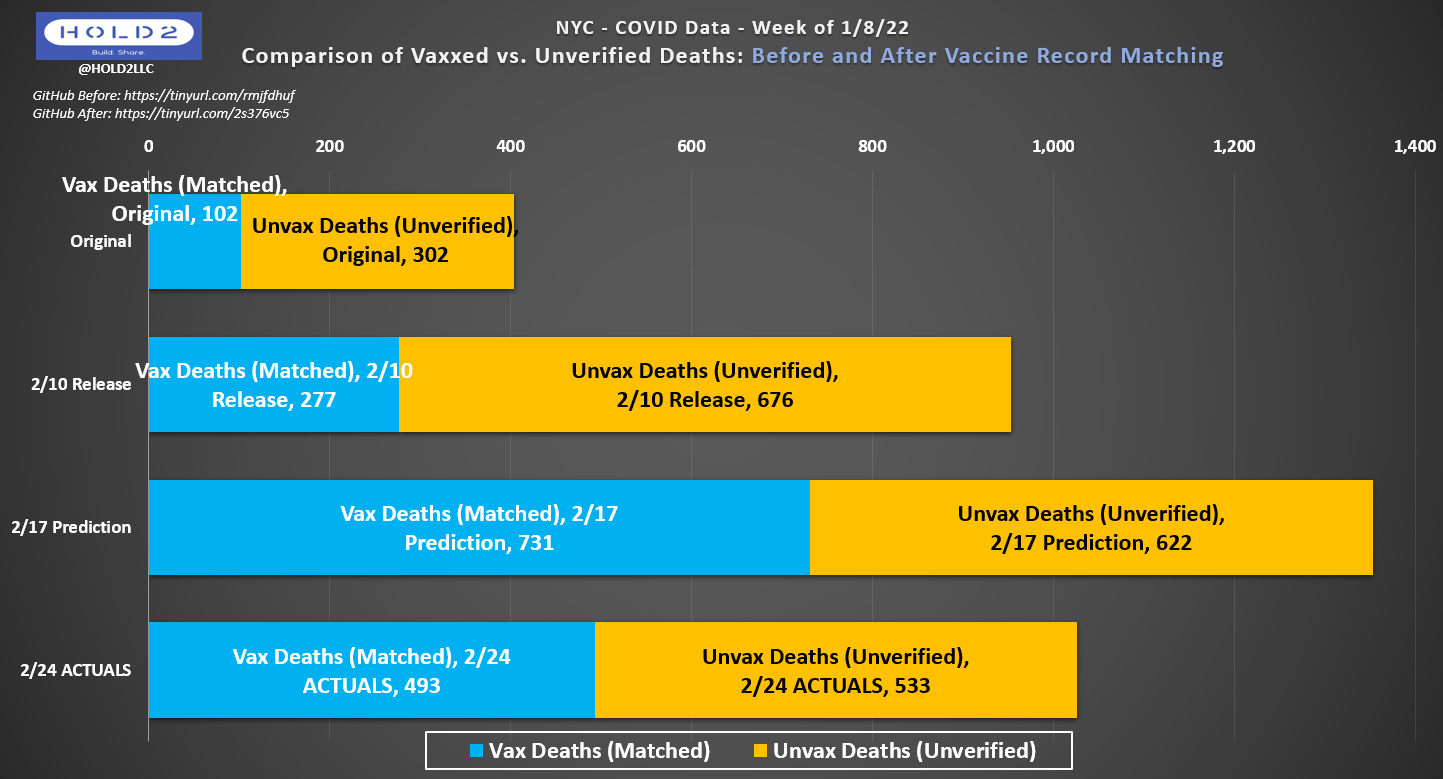
We got EXACTLY what we expected, and my predictions were basically perfect for Cases and Hospitalizations while being fairly close for Deaths.
These charts show my predictions and the actual results:
Cases
Hospitalizations
Deaths
Numerically, here were the predictions and results for Week of 1/8/22 data:
Vaxxed % Predictions:
Cases: 23.19% -> 60.00% | Actual: 62.10% (+2.10)
Hospitalizations: 28.00% -> 53.01% | Actual: 53.18% (+0.17)
Deaths: 25.25% -> 54.03% | Actual: 48.05% (-5.98)
Progression from Original to 2/10 to 2/24:
Cases: 23.19% -> 38.25% -> 62.10% (+38.91, +168%)
Hospitalizations: 28.00% -> 34.04% -> 53.18% (+25.2, +90%)
Deaths: 25.25% -> 29.07% -> 48.05% (+22.8, +90%)
Net Unvax->Vax Change from Original to 2/24:
Cases: 192,412
Hospitalizations: 3,265
Deaths: 160
How could we get this close? It’s just a matter of finding consilience through pattern matching. Shout out to The Ethical Skeptic. These data aren’t done changing either. More will shift from Unvax to Vax, which we saw happen for Week of 1/1 in today’s update, too.
I have a bunch more charts to update and post, so I’ll publish this and create Part 2 next.


This is a great post, I am amazed how CDC gets away with so much lying.
Other coast: https://drflurmgooglybean.substack.com/p/seeking-kernels-of-truth?r=r6d2x&utm_campaign=post&utm_medium=web