Are Vaccinations REALLY Our Way Out of This Pandemic?
The population-level data suggests there are OTHER things at play which have a BIGGER influence on the pandemic. Today, we explore the data suggesting vaccination rates DO NOT influence the course.
Do vaccination rates impact the course of the virus? Note: this is a different question than "do vaccines work?" I believe vaccines can reduce severity of COVID-19 for individuals - but do they stop the overall virus from its course? Do lower county vaccination rates mean higher virus cases? Do higher vaccinated population lead to lower deaths?
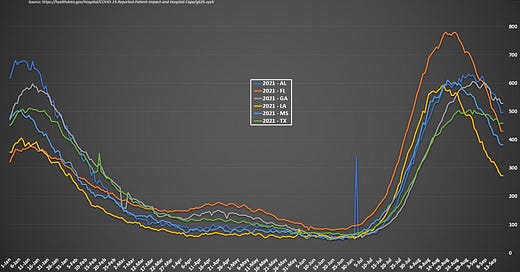
This chart provided by the inestimable @Hold2LLC shows the incredible synchronized waves of hospitalizations per million for these southern states: AL, FL, GA, MS, LA, TX. These states have different demographics, NPIs, mask mandates, vaccination rates and yet they are all moving in synchrony! But that’s just 6 data points.
Let's map these to county level
We're looking for correlation. Almost all data originates with counties so let's do this:
1) Map ALL the counties from these 6 states on an x-axis / y-axis plot
2) Narrow the timeframe to look at JUST the big recent wave
3) Compare vaccination rates to cases and deaths.
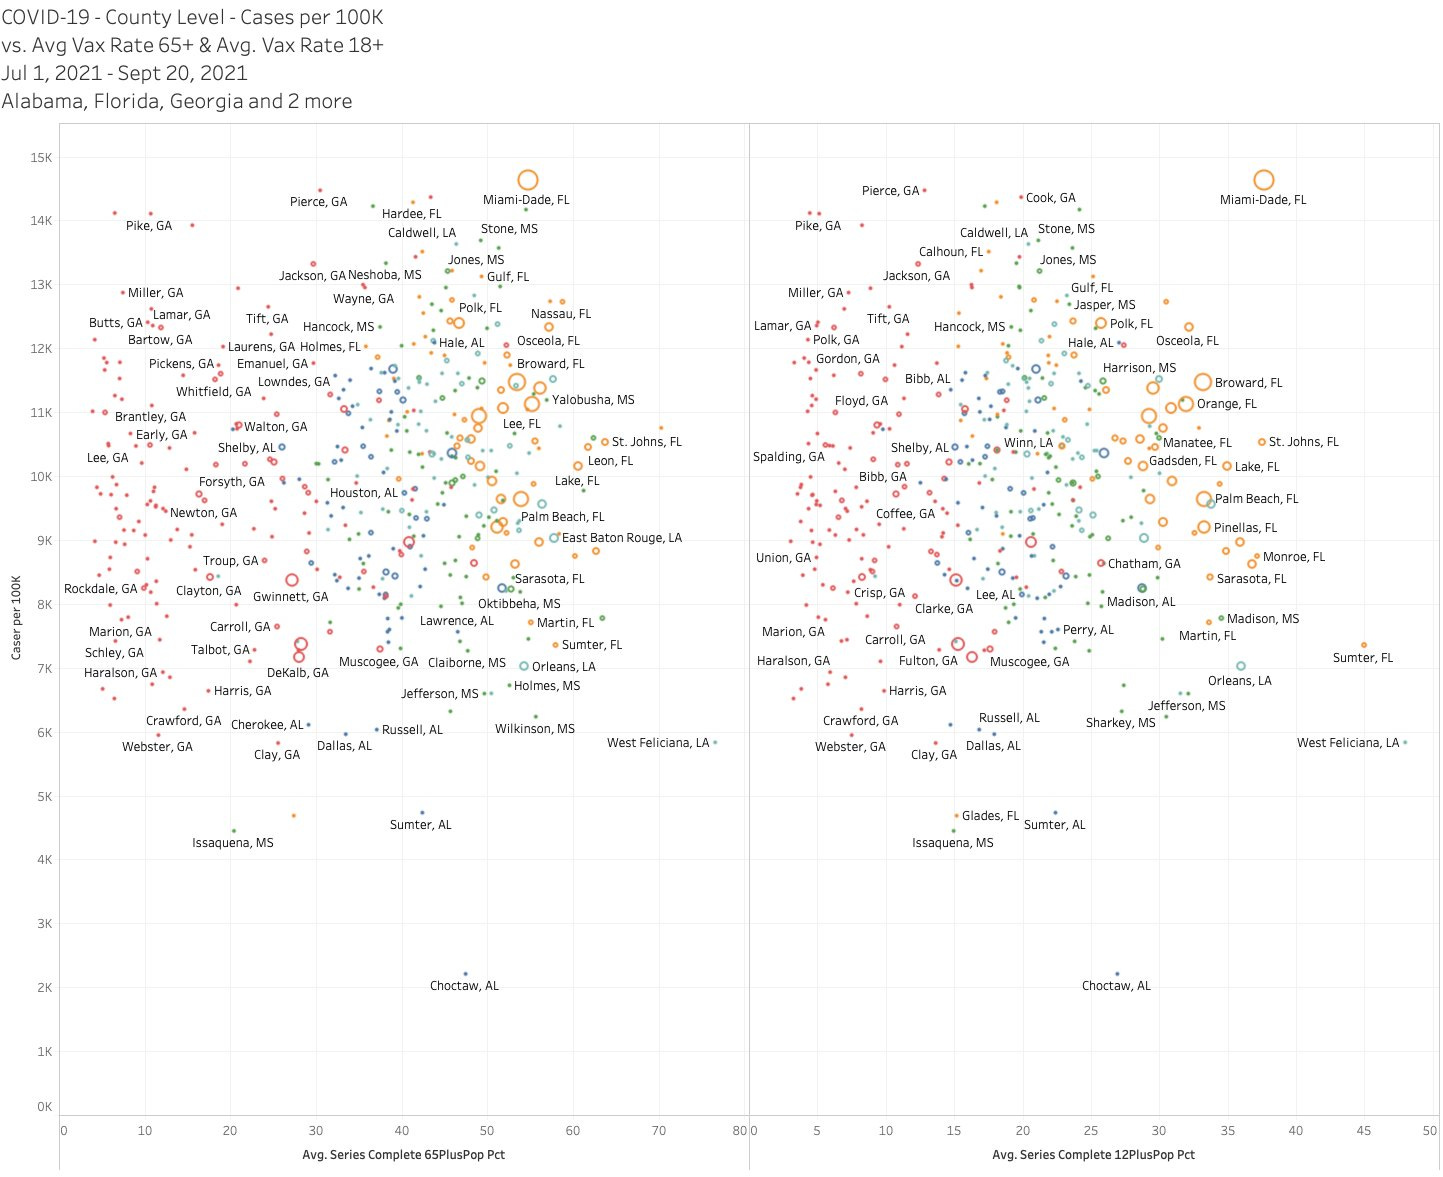
This x-axis shows two metrics: completed vaccination percentage for 65+ age and for 12+ — so we’re showing both the most impacted and the full extent of potential vaccination for a county.
The y-axis shows the the number of cases per 100K population from July to Sept 20 (the time of the BIG wave in the first chart above).
Size denotes population of that county.
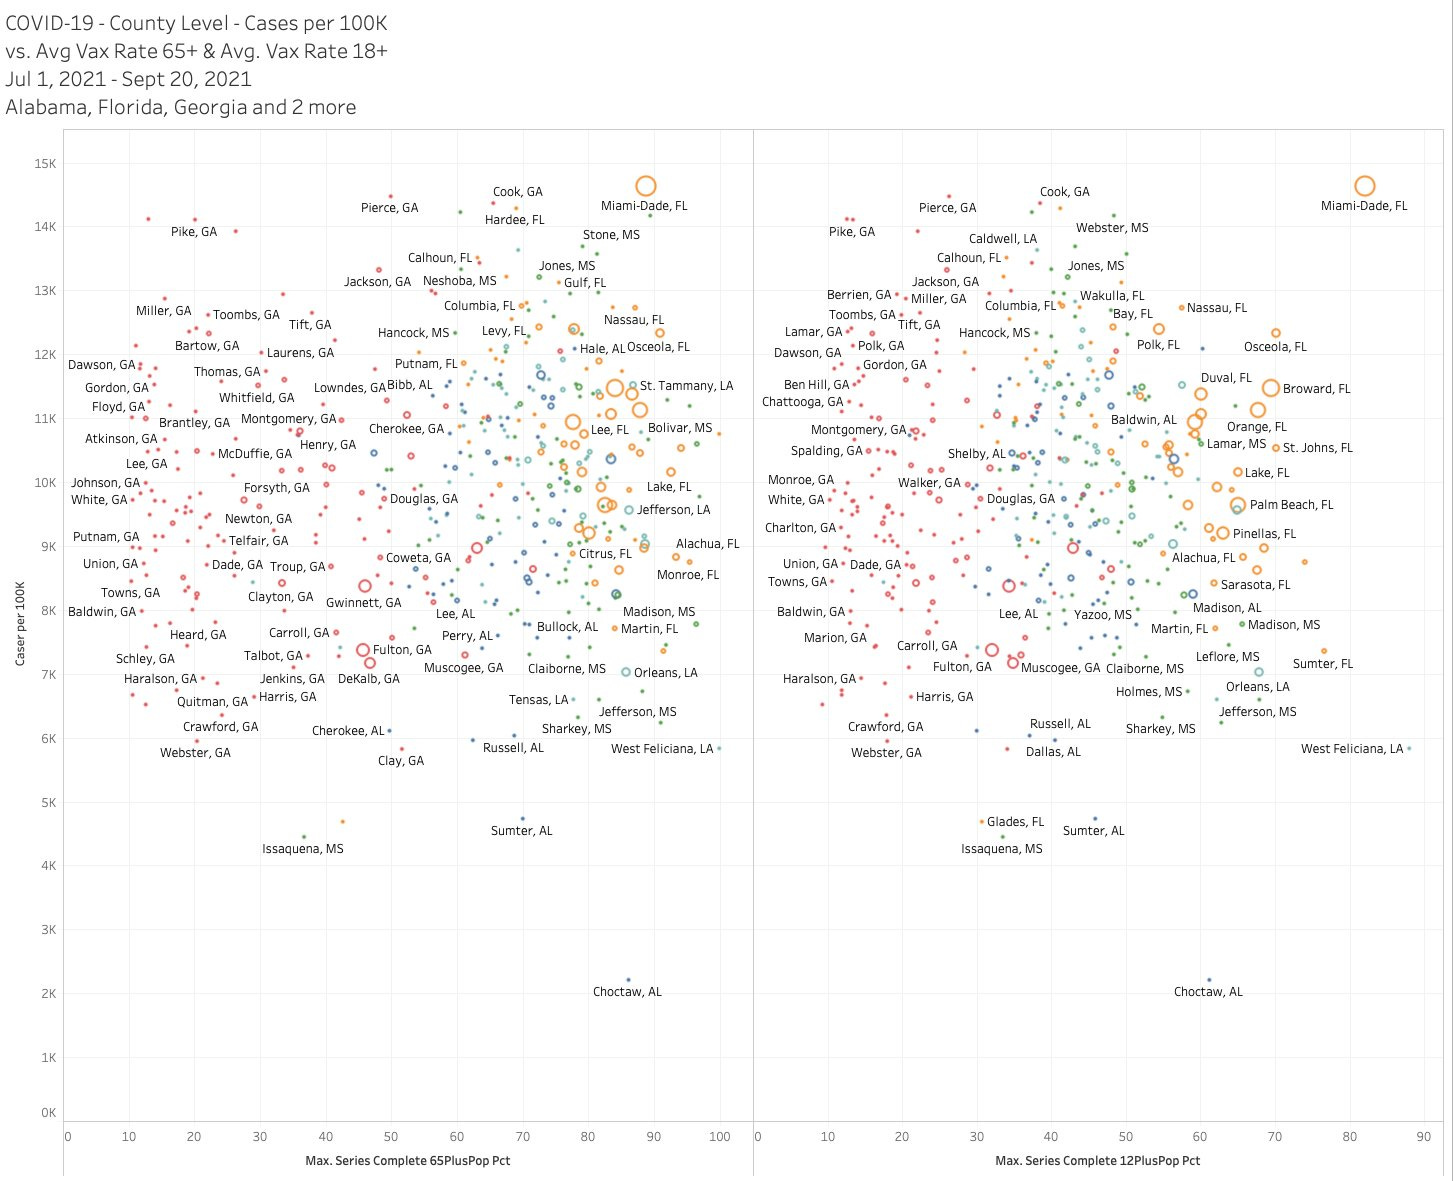
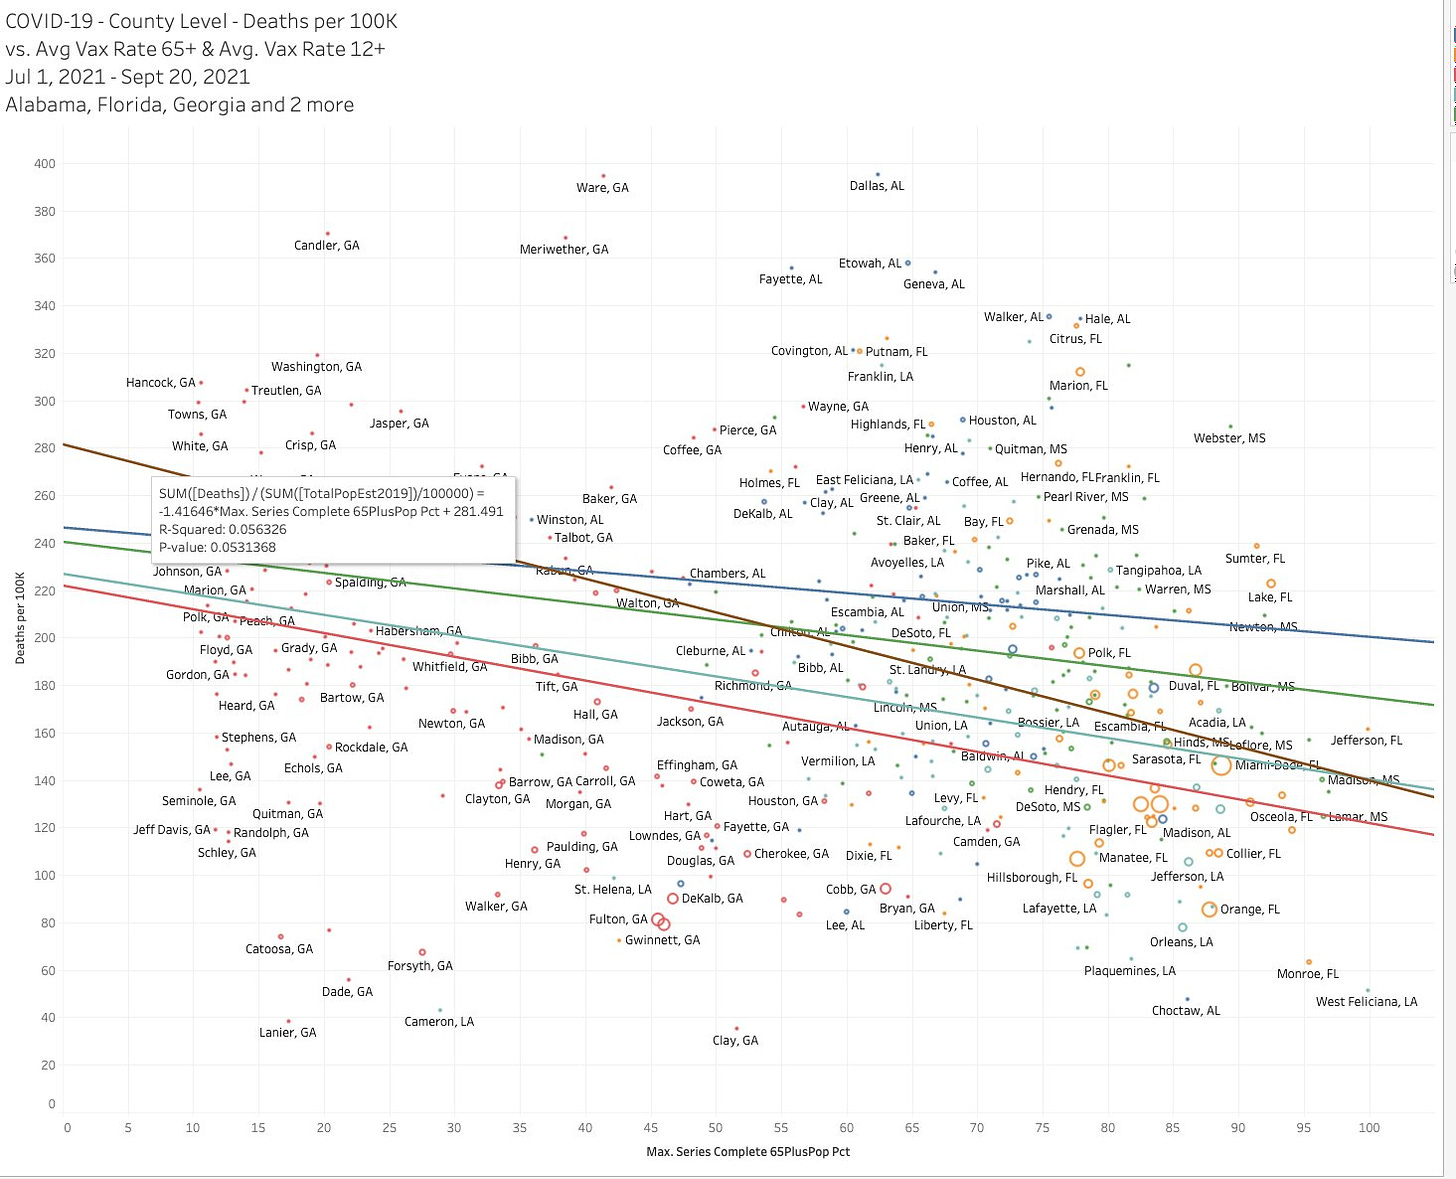
No correlation can be seen. Miami County, FL had the highest average vaccination rate during that time period and the highest case rate. Fulton County, GA has a lower vaccination rate and a lower case rate. Let's give them the benefit of doubt & do max vaccination rate for that wave.
Any patterns? None that I see. We know that vaccines didn't quite live up the promises that Fauci & Walensky made in March/April that they "100% protect against hospitalization and death" and that vaccinated people “do not carry the virus” so let's map against deaths per 100K.
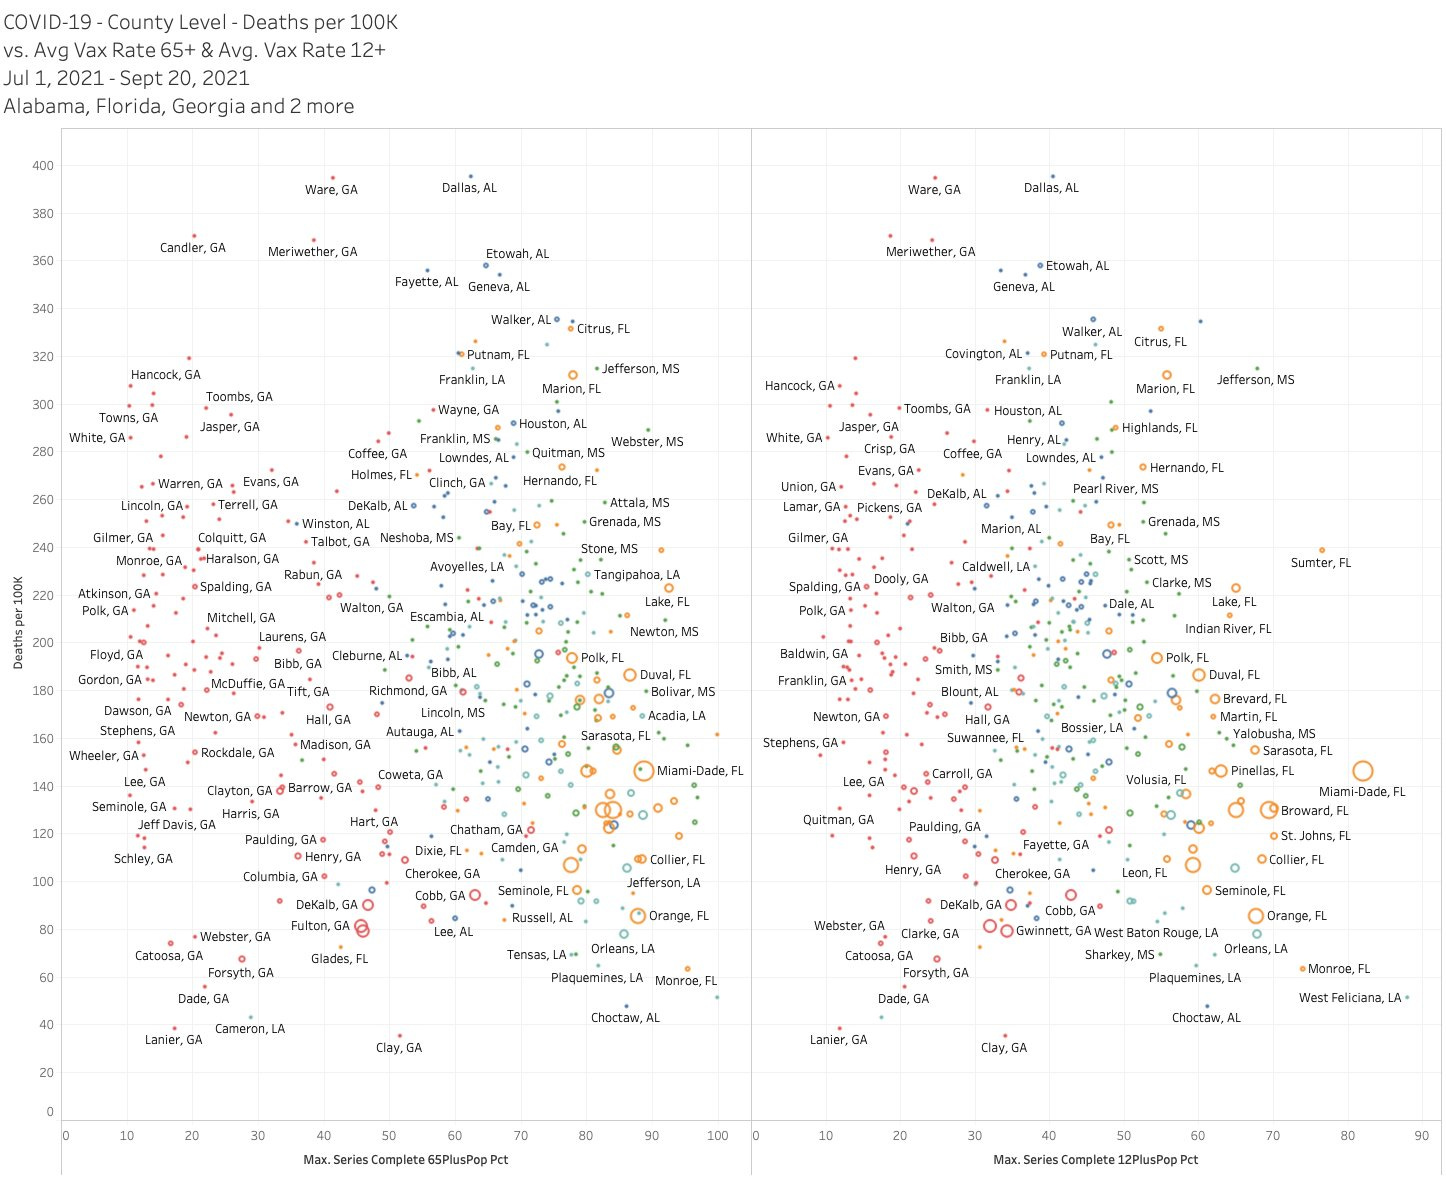
Again - this is one of the BIGGEST waves for these states.
Y-axis is now deaths per 100K for that timeframe. Some of these counties got walloped. But again… no clear pattern appears to show that vaccinations rates had ANY influence on the impact of the virus during that wave.
To reiterate, that’s not to say that vaccines can help individuals - they can by the evidence we have - but they seem to have very little impact on the overall ebb and flow of the virus taking its course.
Well let's throw some trendlines at this anyway.
Weak. No R2 above 5%.
Bottom line: the course of the virus IS NOT impacted by masks, lockdowns, NPIs, or even vaccination rates for that matter. There are larger things like seasonality at play here.
And here's one for @AstorAaron
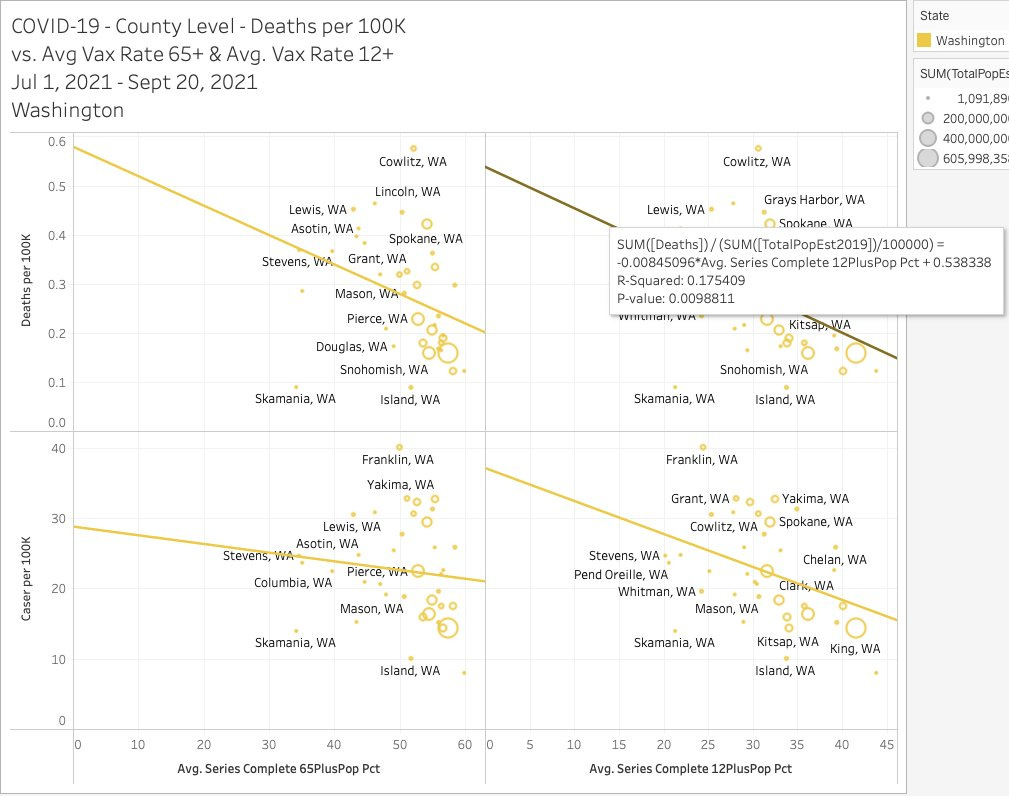
Looking at Washington State. No strong correlation with max or average vaccination rates and cases or deaths. The virus... is gonna virus, vax rates will help people on an individual basis but they are NOT a good gauge of "beating" the virus
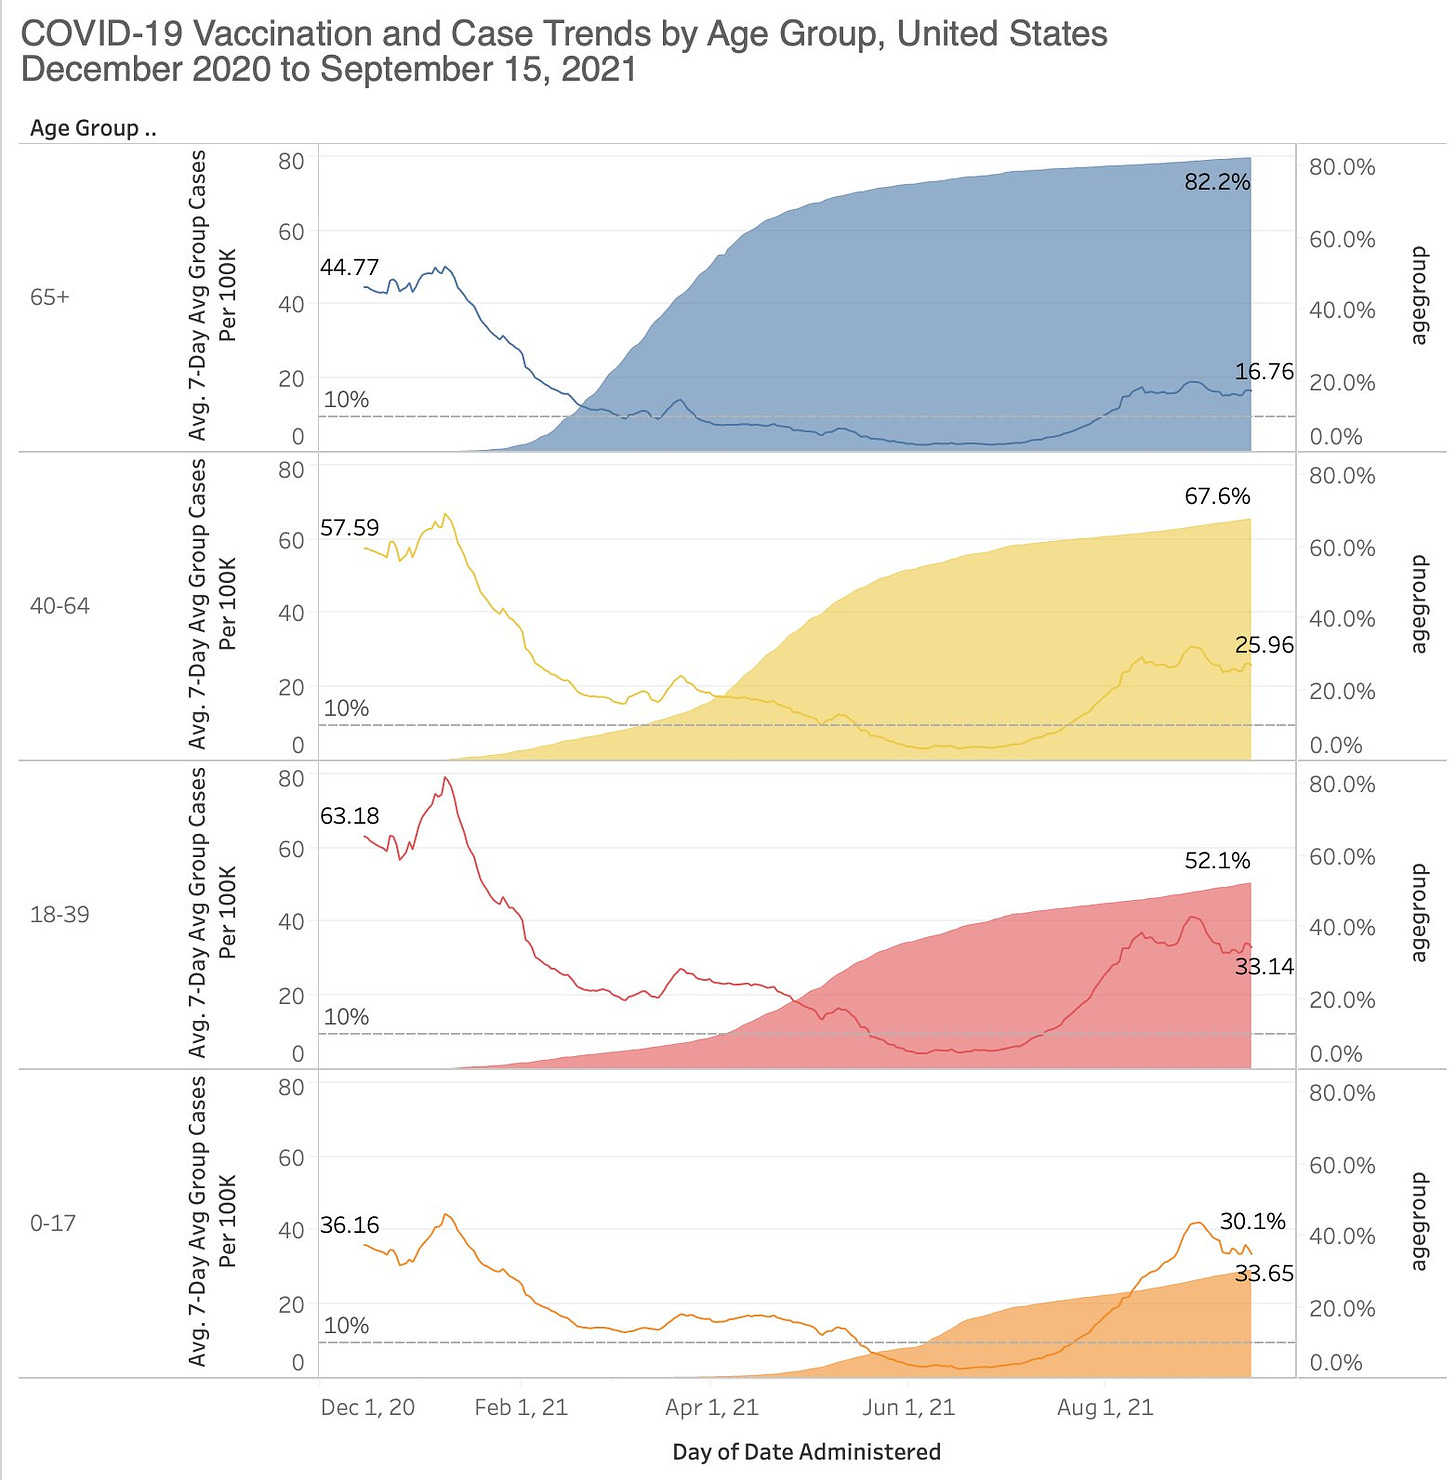
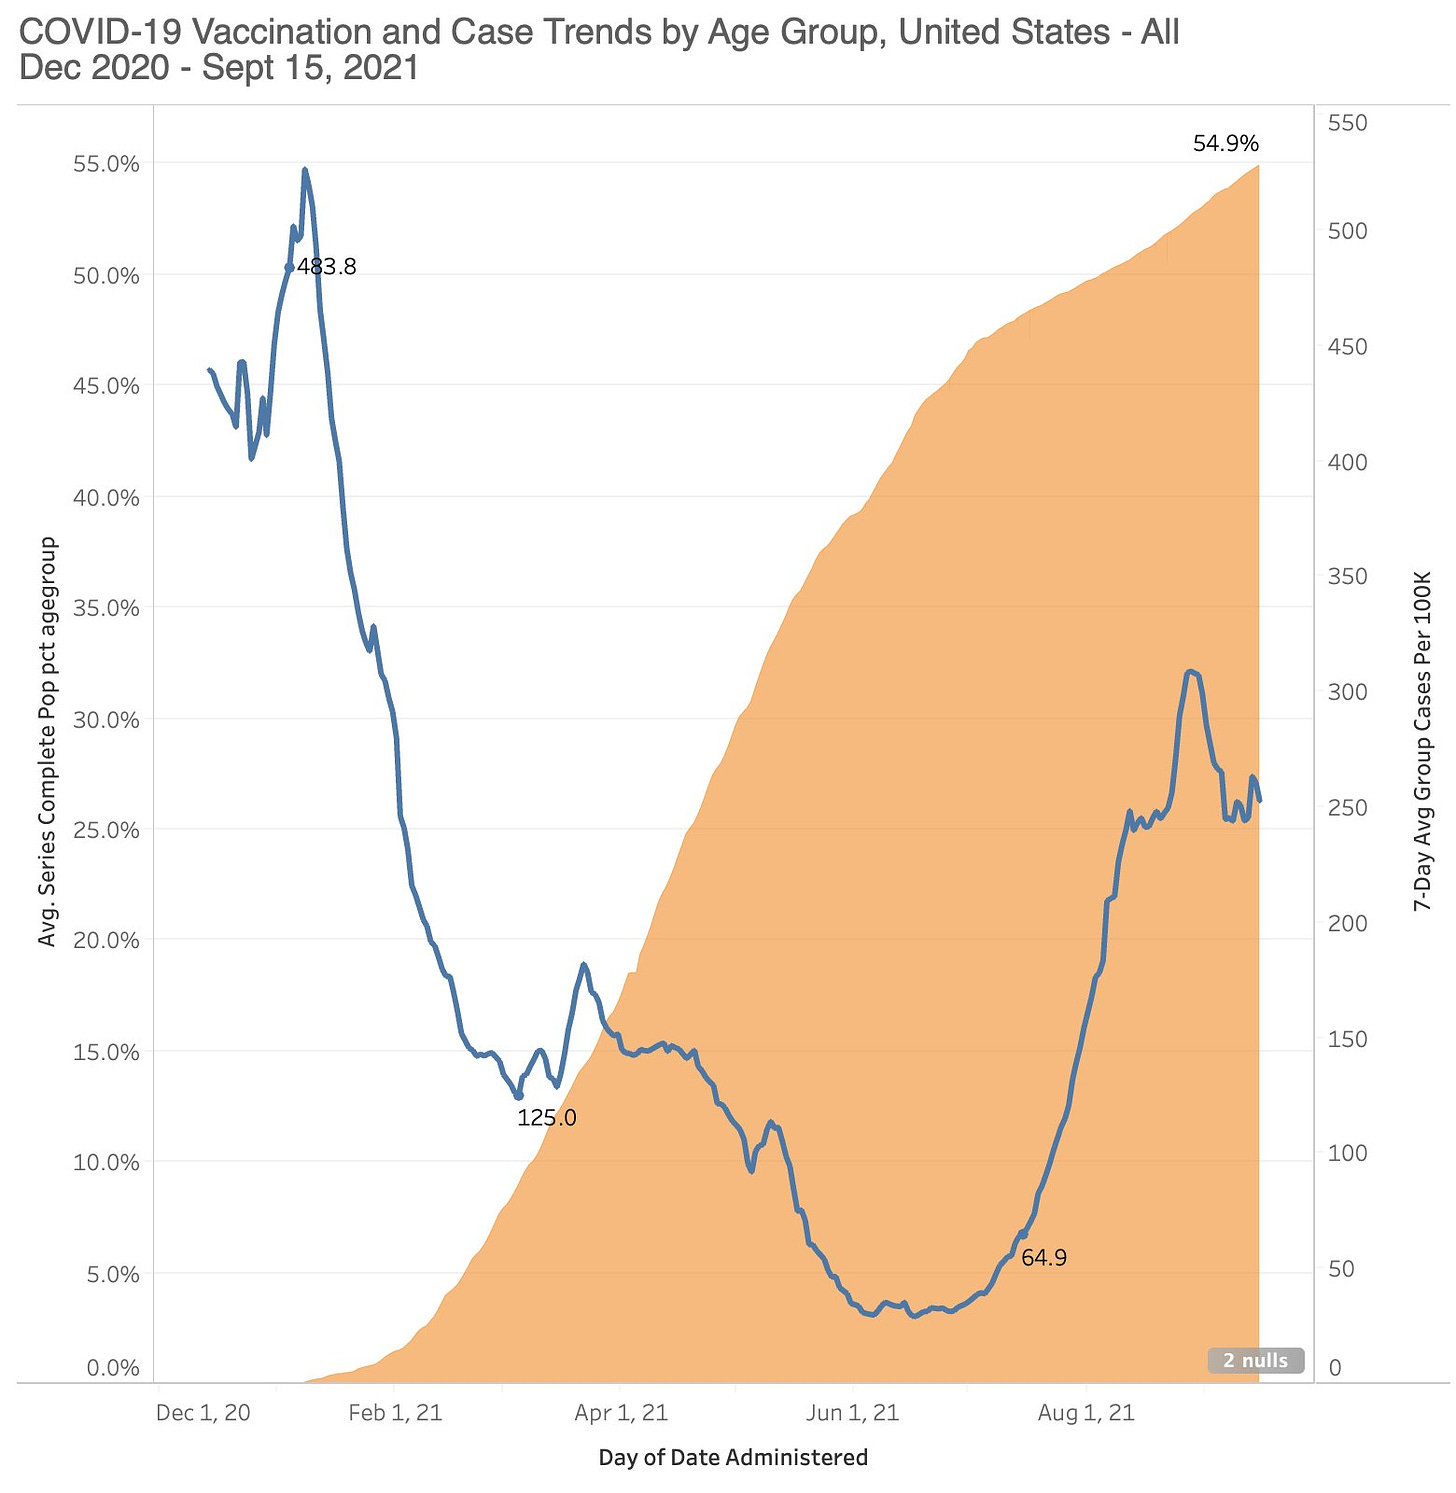
The CDC puts out a great file on cases and vaccination rates by age groups. Right now case rates are moving... sideways as HHS Region 4 (FL + south states) drop and Regions 1,2,3,5,8 start rising. STILL no correlation I can see between overall case rates and vax rates. Cases drop 75% before any group hits 10% vaxxed



I'm glad to see you mention seasonality. We've seen all along that there is no (good) relationship between masks and lockdowns and coronavirus outcomes. While the media select specific time frames to show the results they want, they can't explain the extreme peaks and valleys over time. Lockdown requirements and masking habits tend to hold steady over time, yet coronavirus outcomes climb and fall dramatically at predictable times of year depending on climate and environmental conditions.
Coronavirus rates are driven by seasonality, mostly by weather. The worst places are those with long stretches of gray skies at high latitudes with temperature lows in the 30s (just above freezing)—places like northern Europe and our mid-Atlantic coast in the winter and early spring.
So, what happens in the summer? In the U.S., air conditioning happens. Last summer (2020), we got the headlines complaining about failures of masking and obedience in Texas, Arizona, Florida, Georgia, etc. We could predict the same headlines this year at exactly the same time, only this time the headlines would complain of anti-vaxxers in addition to anti-maskers and anti-lockdowners. The press vilify southern states because the states lean Republican, but politics have nothing to do with it. Our states are large, especially many of the southern states. There is no "Texas" coronavirus result or "Florida" result or "California" or "New York" result. Results are as local as the weather.
Florida is our hottest state. (It is also our lowest and flattest state.) Within Florida, southern Florida is especially hot: tropical, with gray skies in the summer. People go inside into dry, stale air. Fulton Country, Georgia, containing Atlanta, is considerably farther north than Miami, and it is inland, with sunnier summer skies.
Hospitalizations in the South spiked around mid-August. Infections would have peaked a couple of weeks earlier. Miami's average daily temperate range on August 1st is 78-89. Atlanta's daily range is 71-88. Miami skies are only 36% clear, mostly clear, or partly cloudy. (The rest of the time is mostly cloudy or overcast). Atlanta, by contrast, is 59% clear, mostly clear, or partly cloudy. Although both Miami and Atlanta have nearly universal air-conditioning (98% each), people in Miami have more reasons to stay inside in July and August, and less sunshine to boost immune systems when they do go out. Even modest differences in temperature will have a significant impact on the sharpness of the curve, given the compounding effects of spreading.
Large parts of Africa, the Middle East, and Asia have tropical climates similar to that of southern Florida, but they do not have similar rates of air-conditioning or similar coronavirus outcomes.
Other factors come into play: Miami residents have an average age of 40, while Atlantans average just 33. And so on. But we will find no correlations with masking, lockdowns, and now vaccine rates and coronavirus outcomes. We can predict the coronavirus peaks and valleys with changes in the weather.
This suggests that a winter wave is coming. The fact that since delta took over, cases have been and continue at levels above 1 year ago across the country itself suggests that this winter wave should be larger than last year. Further, deaths should also be higher (last year at this time 7 day deaths were ~700. This year it's >1500). This week "experts" said the opposite.