Quick chart: conditions associated with Covid deaths
I’m gonna be honest with you. It’s a slow month at the CDC. They haven’t updated the case surveillance file. They haven’t updated a lot of things. I would think with 20,000 employees they might be able to produce on a higher scale.
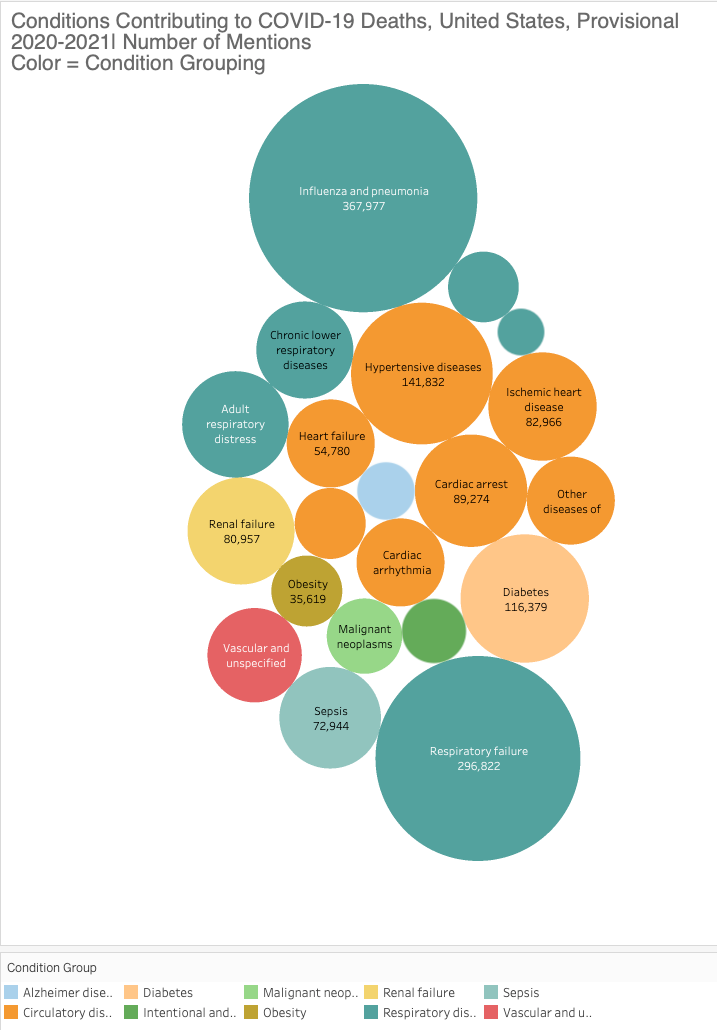
Regardless, here are two interesting charts showing the number of “mentions” of conditions associated with COVID-19 deaths. What you see here are the different types of comorbidities which people typically succumb to in conjunction with Covid.
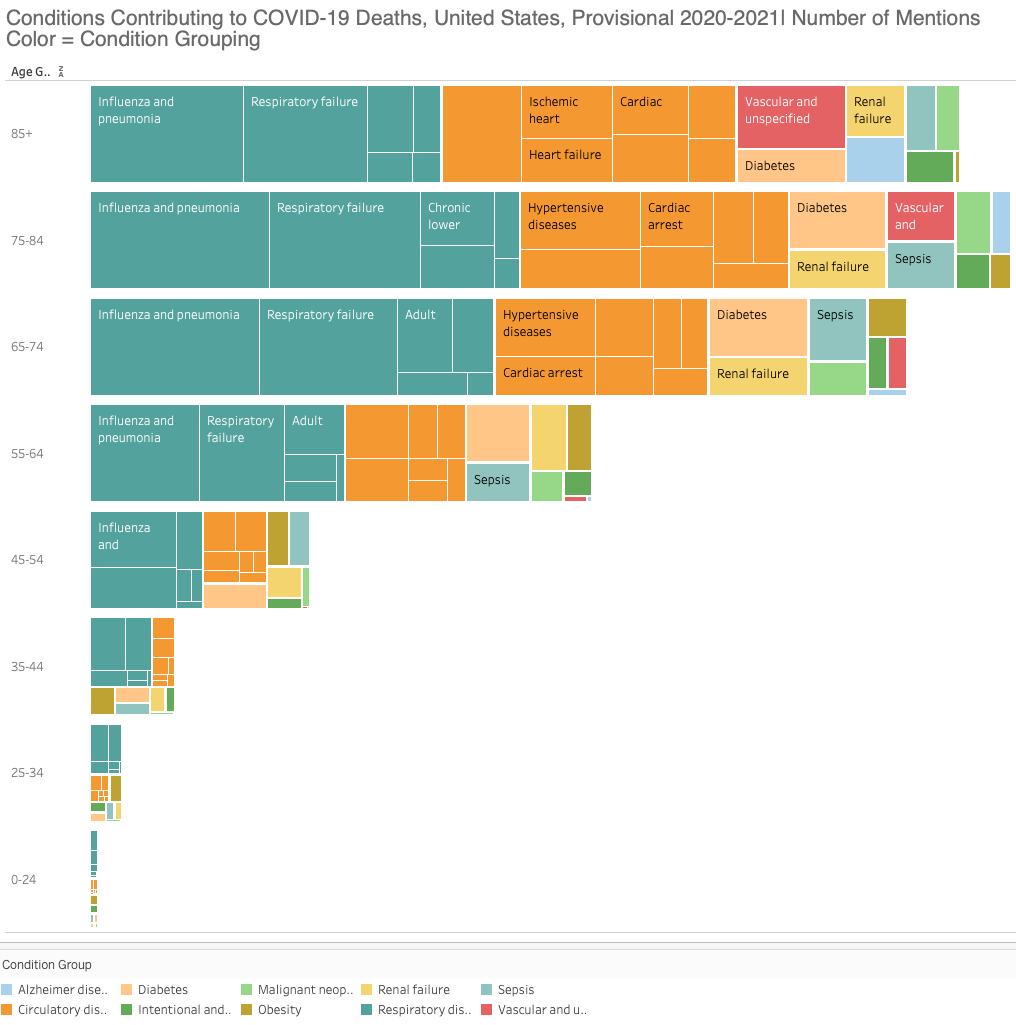
The color coding denotes the condition group and the legend is below.
tell me your thoughts on the comments
here are the same details call by age bracket in a tree map


Influenza and pneumonia... that needs to be splitdown. Pneumonia from covid-19 makes sense. If influenza and covid-19, determining causality is impossible (and really bad luck!). Renal failure=Remdesivir. Respiratory failure=ventilator.
So... it's the flu?